Section Topics
Using the InterAction Report Designer
The InterAction Report Designer is a tool that contains many powerful features that let you build the reports your organization needs. Using the InterAction Report Designer, you can:
- Define the overall size and layout of the report
- Add and remove fields, and control their display (including placement, size, and font)
- Perform calculations including sum and total of numeric fields
- Group data
- ... and much more.
This section provides information on how to use basic features in the InterAction Report Designer.
See the following for more information:
- Adding a Header to a Report
- Adding InterAction Data Fields to a Report
- Adding Labels to a Report
- Adding Long Text Fields to a Report
- Adding Other Controls to a Report
- Selecting Multiple Controls
- Formatting Controls
Adding a Header to a Report
Determine if you want a page header or a report header. A page header is repeated on every page whereas a report header only appears on the first page of the report.
NOTE Overview report sections do not include PageHeaders and ReportHeaders.
- In the report detail area, check if the header you need is already on the report. You should see either PageHeader or ReportHeader. If the header you want to use is not on the report layout, right-click the report and choose Insert > Report Header/Footer or Insert > Page Header/Footer.
-
To change the color of the header, select the header divider then change the BackColor property for the section.
For details on changing a background color, see Setting Foreground and Background Colors.
-
To add text to the header, draw a label. In the properties for the label, specify the header text you want to display in the Text property.
For information on how to add a label, see Adding Labels to a Report.
For information on setting the font for the label, see Setting Font Properties for Individual Controls.
Adding InterAction Data Fields to a Report
There are two ways you can add InterAction data fields to your report:
- Click and drag the field from the InterAction or Calculated fields list
- Draw a TextBox or RichTextBox control on the report, then in the DataField property, specify the data you want that textbox to include.
IMPORTANT If you are adding a field that has the potential to include a large number of characters, use the RichTextBox control instead of the TextBox control or drag the field directly onto the report. For more information, see Adding Long Text Fields to a Report.
Adding a Field by Dragging it From the Fields List
-
Choose the field you want to add to the report from the InterAction or Calculated fields list.
-
Drag the field onto the section of the report where you want to add the field.
The mouse pointer shows the size of the control and a plus sign.
-
With the field selected, modify the look and behavior of the field by changing settings in the properties area.
Adding a Field by Drawing a TextBox
-
From the toolbox, choose TextBox or RichTextBox.
-
Move the mouse pointer to the section where you want to add the textbox.
The mouse pointer changes to a cross hair.
-
Click and drag the mouse to size the rubber band to the desired size of the textbox.
-
With the textbox selected, choose the field to display in the DataField property. To customize the data you want to display, see Calculated Fields.
Adding Labels to a Report
Labels are used for labeling information only - you cannot manage the output format on labels. For example, you cannot use Sum, Count, CanGrow, or CanShrink. To add a text control that allows you to manage the output format, use a TextBox control.
-
From the toolbox, choose Label.
-
Move the mouse pointer to the section where you want to add the label; the mouse pointer changes to a cross hair.
-
Click and drag the mouse to size the rubber band to the desired size of the label.
-
With the label selected, enter the text you want to include in the label in the properties area (in the Text property). Change any other properties if necessary.
Adding Long Text Fields to a Report
Add long text fields (fields that allow a high number of characters) and HTML fields like news articles to your report by using the RichTextBox control instead of dragging the field directly onto the report.
If you do not use the RichTextBox control to add a long text field to the report, the report may require a long load time when it is run. It is also possible that the report may not load.
IMPORTANT RichTextBox controls use the Normal font style. To change the font used for a RichTextBox control, you must change this style. See Changing the Normal Style (Default Font).
Following are examples of fields that can contain long text:
- Activities and Appointments: Description
- Any Notes fields
-
The following Matter, Opportunity, and Engagement fields:
-
Description
-
Our Role
-
Outcome Description
-
When creating a report that contains any of the long text fields listed above, do not drag the field directly onto the report. Instead, do the following:
-
Choose the RichTextBox control in the toolbox.
-
Draw a textbox onto your report layout (where you would like to place the long text field).
-
In the DataField property in the properties area (under the Data section), select the long text field from the drop-down list.
-
When you are finished designing your report, choose File > Save Layout to save your changes.
Adding Other Controls to a Report
- Choose the control you want to add in the toolbox.
- Move the mouse pointer to the section where you want to add the control; the mouse pointer changes to a cross hair.
- Click and drag the mouse to size the rubber band to the desired size of the control.
Copying Controls or Fields from Other Reports
You do not have to start from scratch with each report that you create. Not only can you use Save as New to create a new report from an existing one, but you can copy and paste controls between reports. When copying and pasting controls, all of the formatting you specified in the properties area for the controls are copied over as well.
Selecting Multiple Controls
You can select multiple controls and then move, copy, or do other things with them as a group. There are three methods to select more than one control:
- Hold down the Shift or Ctrl key while you click the controls you want to select.
- Click in an empty area, and then draw a “rubber banding” rectangle around all the controls that you want to select. Rubber banding does not allow you to select controls across sections.
- Click either the horizontal or the vertical ruler and drag the pointer to draw a shadow covering the controls you want selected. Using this method on the vertical ruler only allows you to select controls in one section at a time. Using this method on the horizontal ruler allows you to select controls across multiple sections.
Formatting Controls
Moving and Sizing Controls
To move a control or a set of selected controls, select the controls you need to move and either drag them with the mouse or press the arrow keys on your keyboard.
To size a control or set of controls, first select the control(s) and then drag the edge or corner of the control with your mouse.
NOTE When you size a control beyond the boundaries of a section, the section does not automatically adjust to contain the control's new size.
Aligning and Sizing Multiple Controls
Control alignment and sizing toolbar buttons make it easy to organize the layout of your report and make sure that controls are sized and aligned precisely.
- Select multiple controls in your report, making sure that the control you want to use as a template for aligning and sizing against is selected last.
-
Click the Align Left
 , Center
  , or Right
  toolbar buttons to align the controls.
Follow similar steps to vertically or horizontally align or size the selected controls. See Alignment Toolbar for the full list of options you have for aligning and sizing controls.
Setting Foreground and Background Colors
Foreground and background colors can be set for sections or controls. By default, all controls, fields, and sections have a transparent background. To change the background color for a section or control, select the section or control and in the properties area select BackColor in the Appearance section. Use the drop-down list to select the color for the background.
By default, all controls have a black foreground color. The foreground color determines the font color used. To change the foreground color for a control, select the control and in the properties area, select ForeColor. Use the drop-down list to select a color.
Alternately, you can change the BackColor and ForeColor for all controls at one time. To do this, choose File > Page Setup, and then choose Styles. Select the desired colors for the BackColor and ForeColor for all controls and then choose OK.
Selecting a Border Style
You can add borders to controls or specify a style for a line included in a report.
-
Select a control such as a label or field on your report.
-
Right-click the control to access the context menu.
-
Select Format Border from the menu.
-
You can set the border on each side of the control by first selecting the line style and color and then clicking the sides (between the + signs) you wish to set. The Presets list contains a list of common border settings. You can click any of the buttons in the Presets list to set the border to the style shown.
Formatting Number and Decimal Fields
You can control the display of a numeric field. For example, you can specify that a field display like 123-45-6789 or 1,234,567.89.
In the properties area for a number field, numeric formatting is set up using the OutputFormat property. Select the ellipse to choose from a list of preformatted number options. If you select a preformatted option, the user's regional settings are used when determining the character used for the decimal and thousand separators.
You can also enter a format for a numeric field directly into the OutputFormat property setting. For example you may enter ###-##-###0 to format a number like 123-45-6789. (Number formats must be entered with # symbols, with a zero as the last character.)
If you choose not to format number or decimal fields, fields that contain numbers or decimals appear with the appropriate decimal separator for the user's regional setting, but no thousand separator.
IMPORTANT Fields that output multiple values separated by a character (such as a semicolon) are always output as text and can never be formatted as number, decimal, or date fields.
Formatting Date Fields
If you choose not to format date fields, all single-value fields that contain dates appear with the date formatted to the user's short date format and include a time of 12:00:00. For example:
03/01/06 12:00:00
This applies to all single-value date additional fields as well as the date fields on activities and appointments.
If you do not want to include the time of 12:00:00, do the following:
In the properties area for the date field, enter either of the following options for the OutputFormat property:
- D - use the “long date” format for the user's regional setting (for example: Tuesday, March 07, 2019)
- d - use the “short date” format for the user's regional setting (for example: 3/7/2019)
Alternately, you can select the ellipse button (…) option in the OutputFormat property to select from a list of preformatted date options. If you select a preformatted date option, note that the user's regional settings for date are not used when displaying the report.
For more information on dates and using date calculations on reports, see Date Calculations.
Using Fonts
By default, InterAction out-of-the box reports use the font Verdana. You can change this font to any font you choose, however note the following:
- Avoid using several different fonts on a report. This includes Overview reports - keep the font the same for all sections. Multiple fonts can make reports unattractive or difficult to read.
- If you change the font on a report, preview the report before making it available to users because fields may wrap differently.
Setting Font Properties for Individual Controls
This procedure instructs you how to change the font properties for individual controls. Note that this procedure does not apply to RichTextBox controls. RichTextBox controls use the Normal style. These fonts can only be changed by changing the Normal style (see Changing the Normal Style (Default Font)).
-
Select the field or control for which you want to change the font. You can change the font for more than one control at a time by selecting multiple fields or controls (see Selecting Multiple Controls).
-
In the properties area, select the ellipse button in the Font property under the Appearance section.
-
On the Font dialog box, specify the Font, Font style, and Size. You also can specify Effects or Script (language) used.
If you choose to use non-English fonts, the language's script must be selected in the Font dialog box, and the language must be available in the system's regional settings.
Alternately, you can use the Format toolbar button and combo-boxes to set font properties for any selected controls. For details on this toolbar, see Format Toolbar.
IMPORTANT The default font is Verdana. If you use international font characters, you must change the font to a font that supports Unicode. See Should I Use a Unicode Font? for more information.
Changing the Normal Style (Default Font)
You can change the default appearance for all controls by changing the Normal style. The Normal style is applied to all controls by default, however you can change the font properties for individual controls, as described in “Setting Font Properties for Individual Controls,” earlier. Note that the RichTextBox controls use the Normal font only and cannot be changed individually.
-
In the InterAction Report Designer, choose File > Page Setup.
-
Choose Styles.
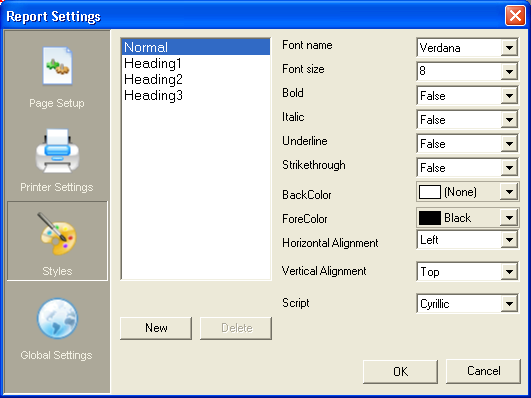
-
Choose Normal in the list of styles and then make any changes to the font on the right side of the dialog.
-
Choose OK.
Should I Use a Unicode Font?
Unicode fonts are fonts that can display text in any language. For example, if you have contacts in Japanese, German, and English in your report, Unicode fonts can display all of these contacts in their respective languages.
If you do not use a Unicode font in your report, text written in foreign characters does not display in the PDF viewer in the InterAction Web Client. For example, if you have a report that lists ten contacts in English and one contact in Japanese, the contact saved in Japanese will be blank in the report.
To prevent this issue, you must do the following:
- Install the Arial Unicode MS font on the AppServer. This font is a commonly-used Unicode font and is included with Microsoft Office.
- In the InterAction Report Designer, make sure that the Arial Unicode MS font is used throughout the report design. You can change the default font to Arial Unicode MS so that all of your controls use that font by default. See Changing the Normal Style (Default Font).